July 13th, 2024
Top 6 Techniques for Better Data Analysis
By Josephine Santos · 9 min read
To an average person, analyzing data might sound easy. You just go over it carefully and draw conclusions based on what you see. But in a world overflowing with big data, such an approach is impossible. There’s simply too much raw data for this process to be even remotely described as “easy.”
But it’s not all bad.
With the right data analysis techniques (and the right data analysis tools), even the most daunting data sets can be distilled into easy-to-understand insights.
What Are the Basics of Data Analysis?
Data is the single most valuable asset in the modern world. Yet, it means nothing without data analysis. Only after data is thoroughly inspected, cleansed, transformed, and modeled can it reveal its true value. And these actions are precisely what happens in a data analysis process.
Common Types of Data Analysis & How It Can Help You
Each data analysis technique falls under a specific data analysis type. Before exploring these techniques, it’s only fair to tackle the most common types of data analysis first.
Descriptive Analysis
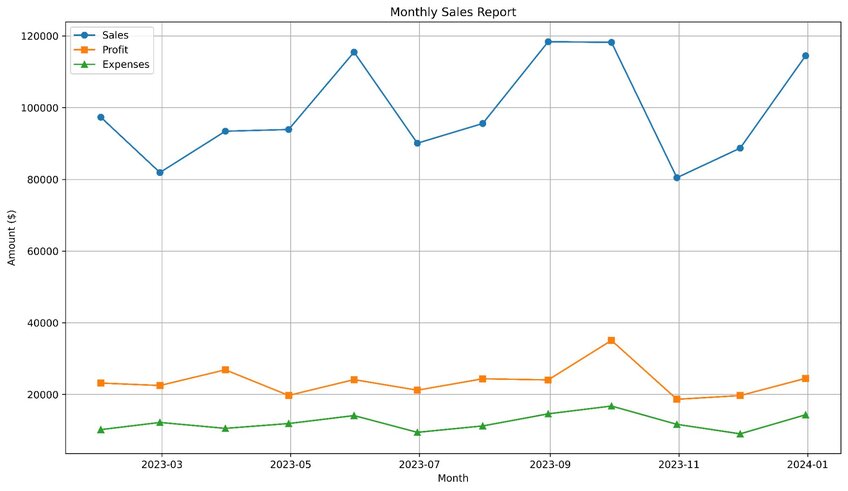
With descriptive analysis, data analysts only aim to understand and summarize the main characteristics of a data set. Examples of this data analytics include sales reports, customer demographics, and website traffic statistics.

Example sales report chart. Created with Julius AI
Diagnostic Analysis
As the name suggests, this data analysis type focuses on making a diagnosis, i.e., discovering why something happened. For instance, a business might experience a surge of negative reviews or customer complaints. Diagnostic analysis exists to uncover the reasons behind such occurrences.
Predictive Analysis
In predictive data analysis, you analyze data from the past to make predictions about future outcomes. Predicting customer buying behaviors, forecasting stock prices, and anticipating equipment failures are just some examples of what this data analysis type can accomplish.
Quantitative Analysis
Quantitative analysis deals with quantitative data. No surprises there! This analysis examines numerical values (and other measurable variables) to understand patterns, relationships, and trends in the data. So, expect to see statistical analysis methods employed in this process.
Qualitative Analysis
At its core, qualitative data analysis is similar to its quantitative counterpart. It examines data to identify themes, patterns, and meanings. But this time, we’re dealing with qualitative data, i.e., textual data, images, and videos.
Also, the qualitative data analysis method doesn’t focus on numbers. Instead, it seeks to understand the context, motivations, and experiences of individuals or groups.
Data Analysis Techniques to Use Today
With all the basics out of the way, there’s nothing left to do but explore the best data analysis models to use today, like:
1. Regression Analysis
2. Monte Carlo Simulation
3. Factor Analysis
4. Cohort Analysis
5. Cluster Analysis
6. Sentiment Analysis
Regression Analysis
Regression analysis is a simple yet essential statistical method used to analyze relationships between variables. It deals with two types of variables – dependent and independent variables. The goal is to determine how independent variables influence dependent variables.
Regression analysis can be both predictive and descriptive. You’ll most commonly see it in fields like economics (e.g., GDP predictions), finance (e.g., stock price movements), and psychology (e.g., factors influencing behavior).
Monte Carlo Simulation
At its core, the Monte Carlo Simulation (MCS) is a computational algorithm – or a broad class of computational algorithms, to be precise. This method involves running multiple simulations (with multiple sets of random input samples) on a system to calculate a range of possible outcomes. Of course, this makes it predictive in nature.
But what does this simulation predict most commonly?
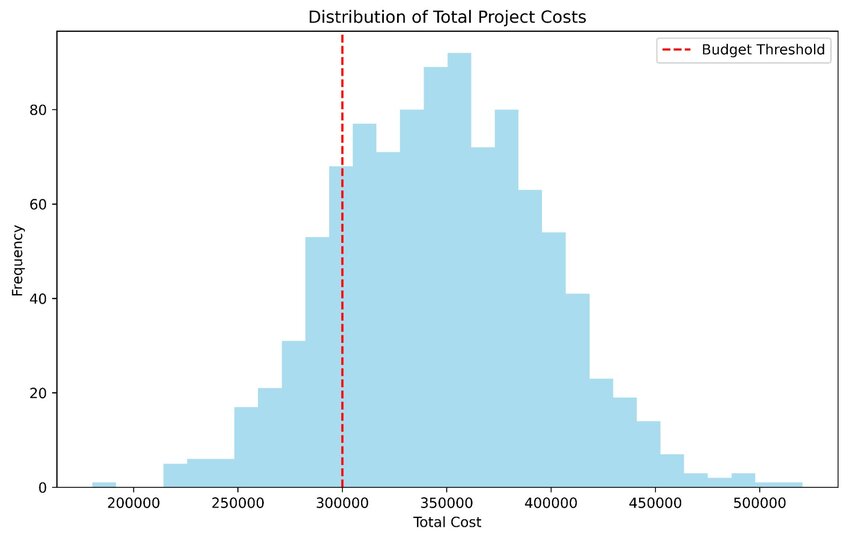
This simulation most commonly predicts the behavior of complex systems or models with uncertain inputs. Portfolio returns, cost overruns, and the reliability of engineering systems (e.g., buildings) are just some common examples.

Example of the Monte Carlo simulation for estimating cost overruns in a project. Created with Julius AI
Factor Analysis
There are three key components of factor analysis – factors, factor loadings, and eigenvalues. The first component, probably the one most familiar to you, is just variables derived from the observed data. Factor loadings are the coefficients representing the relationship between the observed variables and derived factors. And finally, the eigenvalues represent the variance captured by a factor. The higher this value, the more significant factor.
The goal of the factor analysis is simple – reduce the number of observed variables into fewer dimensions. With this, it also simplifies a complex data set.
The areas that use this analysis the most are marketing (e.g., identifying underlying consumer preferences), finance (e.g., assessing risk factors influencing asset prices), and psychology (e.g., uncovering latent personality traits).
Cohort Analysis
Cohort analysis is a behavioral analytics subset that breaks data into related groups based on their shared characteristics (over a specific period). In other words, this analysis doesn’t deal with generalities. Instead, it’s laser-focused on specific groups to identify trends, patterns, and behaviors among them.
From this description alone, it’s easy to understand why cohort analysis is such a valuable tool across numerous sectors. Take e-commerce as an example. With this analysis, online retailers can track how customers behave during seasonal promotions, how their preferences influence their purchase decisions, and how effective social media shops are in helping retain customers.
Cluster Analysis
Cluster analysis is similar to cohort analysis in that it groups similar data points into groups. But that’s all this analysis does. It doesn’t go on to analyze the behaviors of group participants as its cohort counterpart does.
There’s no shortage of cluster analysis examples across various industries. Customer segmentation in marketing. Flora and fauna classification in biology. Genetic profiling in medicine. Cluster analysis is everywhere.
Sentiment Analysis
With sentiment analysis, also known as opinion mining, you analyze textual data to determine the true sentiment behind it. Is it overtly positive, negative, or simply neutral? Sometimes, this analysis can even pinpoint specific emotions behind a text, such as happiness or anger.
This makes it exceptionally valuable for any individual or organization that needs to gauge public opinion on a matter. Think politicians, brands, and researchers. Any of them can extract tons of valuable insights through sentiment analysis.
Use Julius AI for Clean & Effective Data Analysis
Learning all six data analysis techniques from this article is no easy task. And they’re far from the only techniques that exist.
So, wouldn’t it be nice to have a tool that can perform advanced analysis for you, preventing errors and saving you time? Good news – you can have this tool with Julius AI. Whether it’s data visualization or predictive forecasting, this data tool has got your back.
Frequently Asked Questions (FAQs)
What is the best data analysis method for qualitative research?
The best method for qualitative research depends on your goals, but thematic analysis is often a go-to option. It involves identifying patterns, themes, and meanings within textual, visual, or audio data to understand the deeper context and motivations behind it.
What is the best way to analyze quantitative data?
To analyze quantitative data effectively, statistical methods like regression analysis, descriptive statistics, or hypothesis testing are commonly used. These approaches help uncover patterns, relationships, and trends in the data, ensuring accurate and actionable insights.
